

SITCOMTN-179
Characterizing the Influence of Wind Speed and Direction on Portable and Fixed DIMM seeing measurements#
Abstract
This technical note provides a comprehensive comparative analysis of seeing measurements obtained from portable and fixed Differential Image Motion Monitors (DIMM). We investigate the correlation between these two systems and quantify the systematic influences of local meteorological conditions. Specifically, we demonstrate the dependency of seeing discrepancies on wind speed.
Introduction#
In TechNote sitcomtn-169, we demonstrated that the large discrepancies between the PSF FWHM measured by LSSTCam (rescaled to airmass = 1 and wavelength = 550 nm) and the seeing estimates provided by the Differential Image Motion Monitor (DIMM) are correlated with periods of low wind speed (typically below ~4 m/s).
Since the origin of this effect remains unclear, we have decided to install a portable DIMM using identical hardware and software to operate both units simultaneously.
DIMM-1 (Tower DIMM): The permanent device, installed inside a small dome on the weather tower located on Calibration Hill.
DIMM-2 (Portable DIMM): The mobile device, installed on a tripod at ground level, also on Calibration Hill.
Location of the two DIMMs#
The following pictures show the location of the two DIMMs on the calibration hill
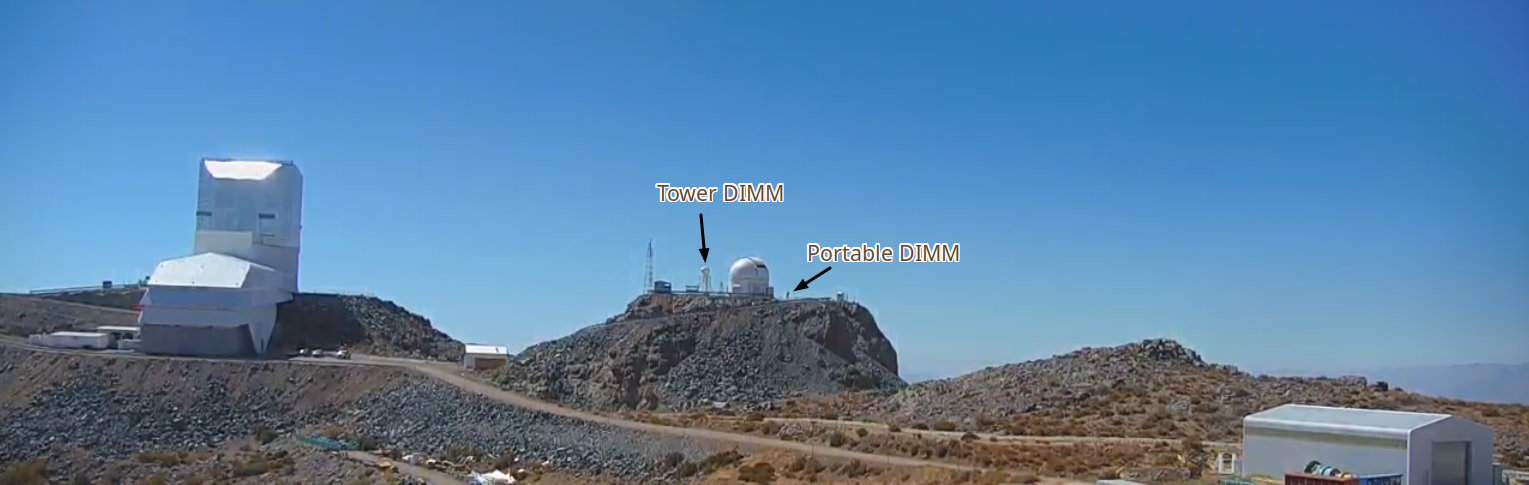
Fig. 1 Landscape view of the Vera C. Rubin Observatory area showing the location of both DIMMs#
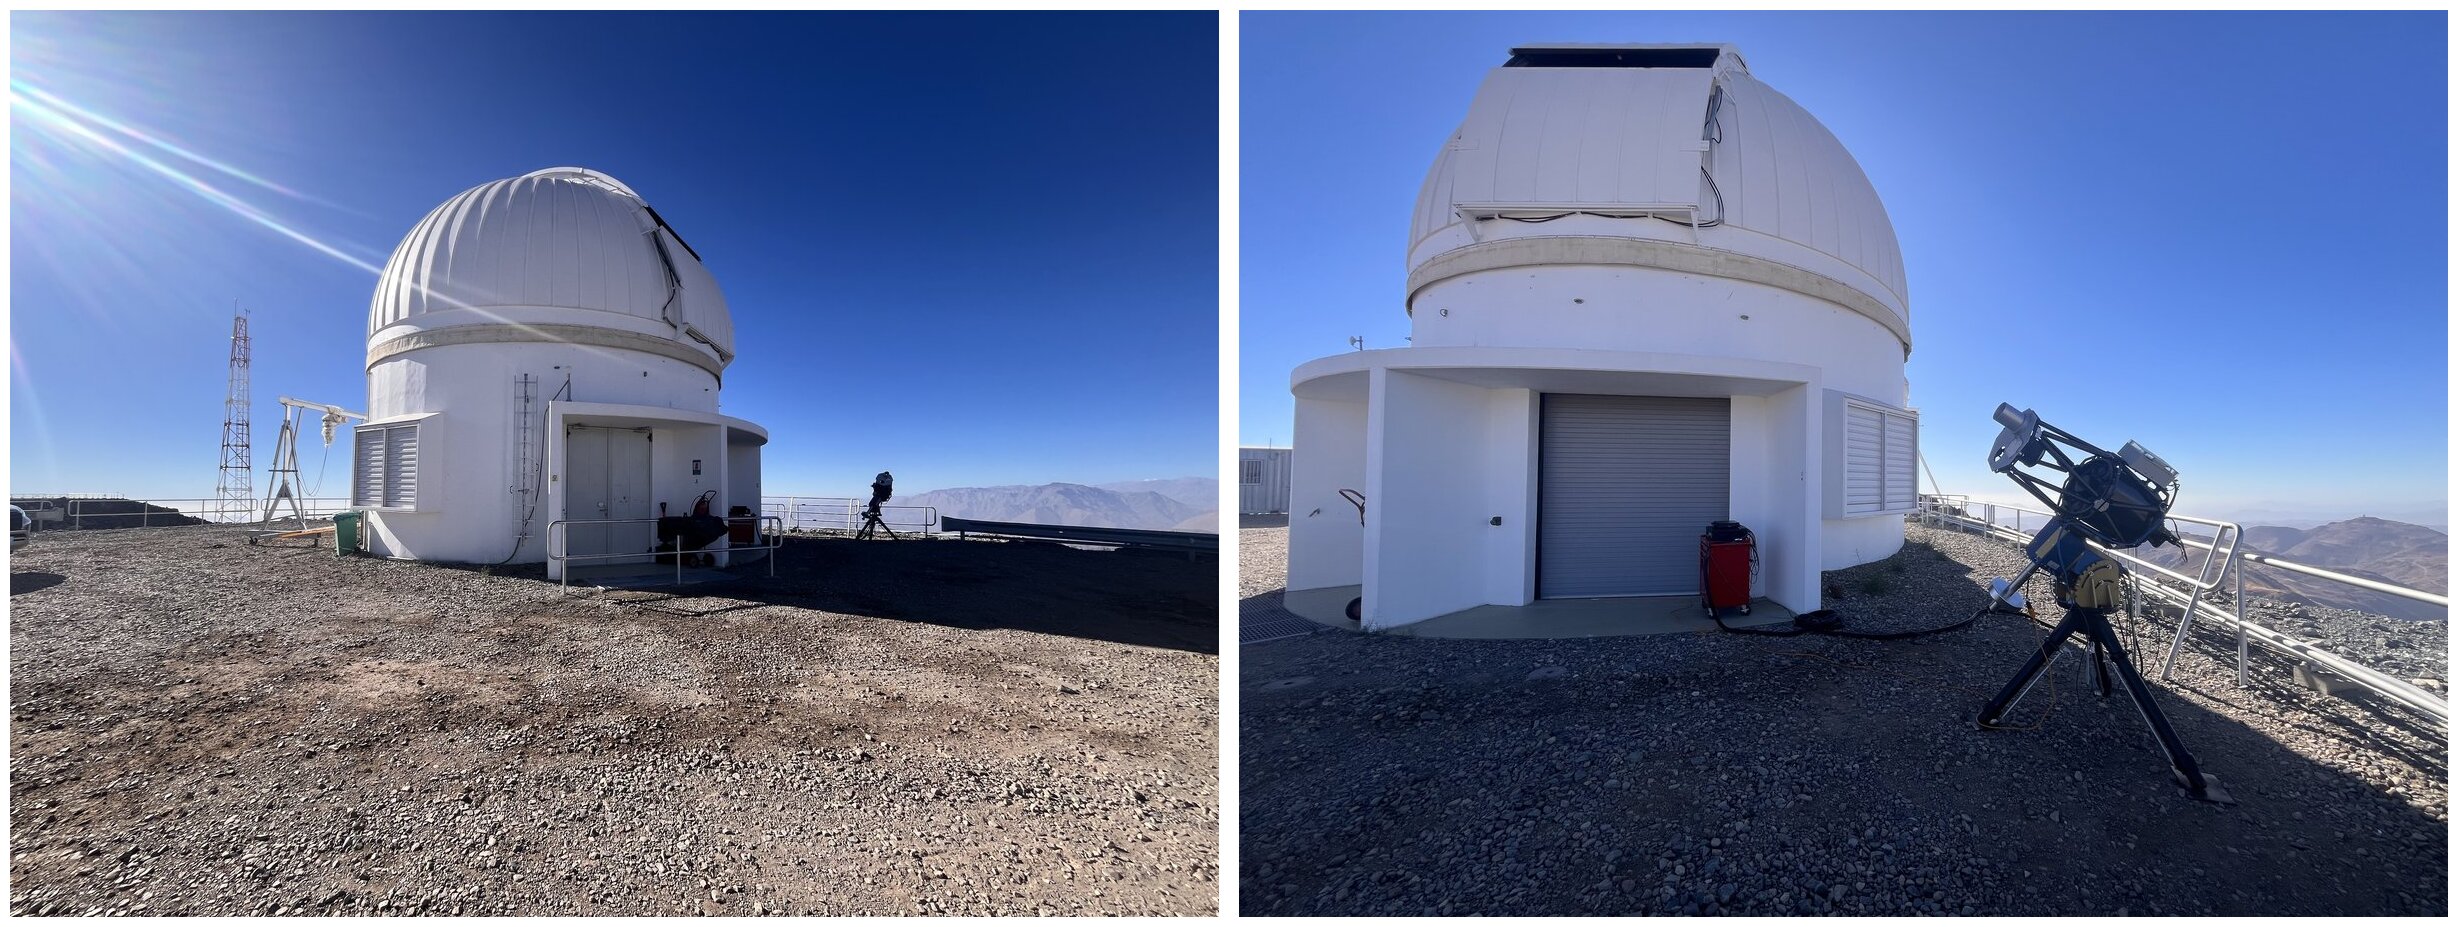
Fig. 2 Location of the portable DIMM close to the AuxTel (Courtesy Kshitija Kelkar)#
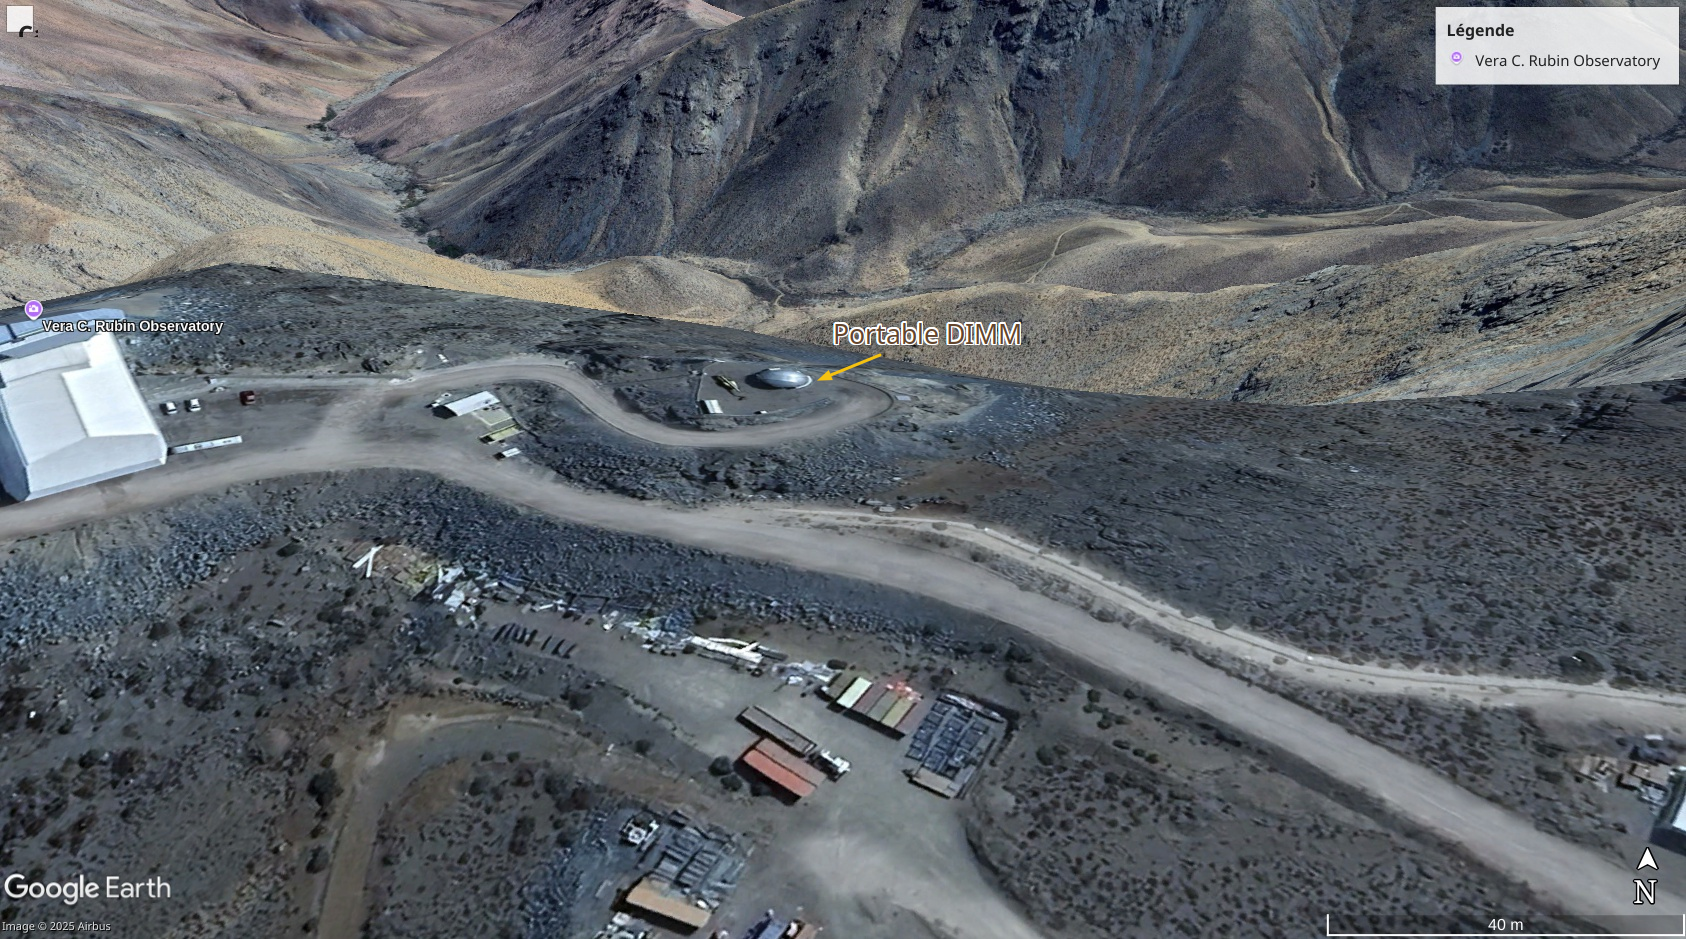
Fig. 3 Google Earth image of Cerro Pachón showing the location of the Portable DIMM#
As shown in the previous photos, the portable DIMM is optimally positioned for the prevailing North-North-East winds. However, it should be noted that the AuxTel dome may introduce mechanical turbulence when the wind originates from the West or South-West.
Characterizing Wind-Induced Effects on DIMM Seeing#
On Cerro Pachón the wind is blowing from the North-North-East ~75% of the time. 25% of the time the wind is blowing from the South or South-South-West.
As the portable DIMM as been operated in parallel of the tower DIMM for several months, a careful comparison has been run on a nightly basis. From this study it has been possible to extract a few typical behaviors that will be detailled in the following sections.
A 3-minute averaging window is applied to the EFD DIMM seeing (FWHM) measurements to reduce noise.
Wind speed larger than 4 m/s and blowing from the North-North-East (dominant)#
In the following figure we plot the seeing measurements from both DIMMs (upper plot) and the wind speed and direction (lower plot) a function of time.
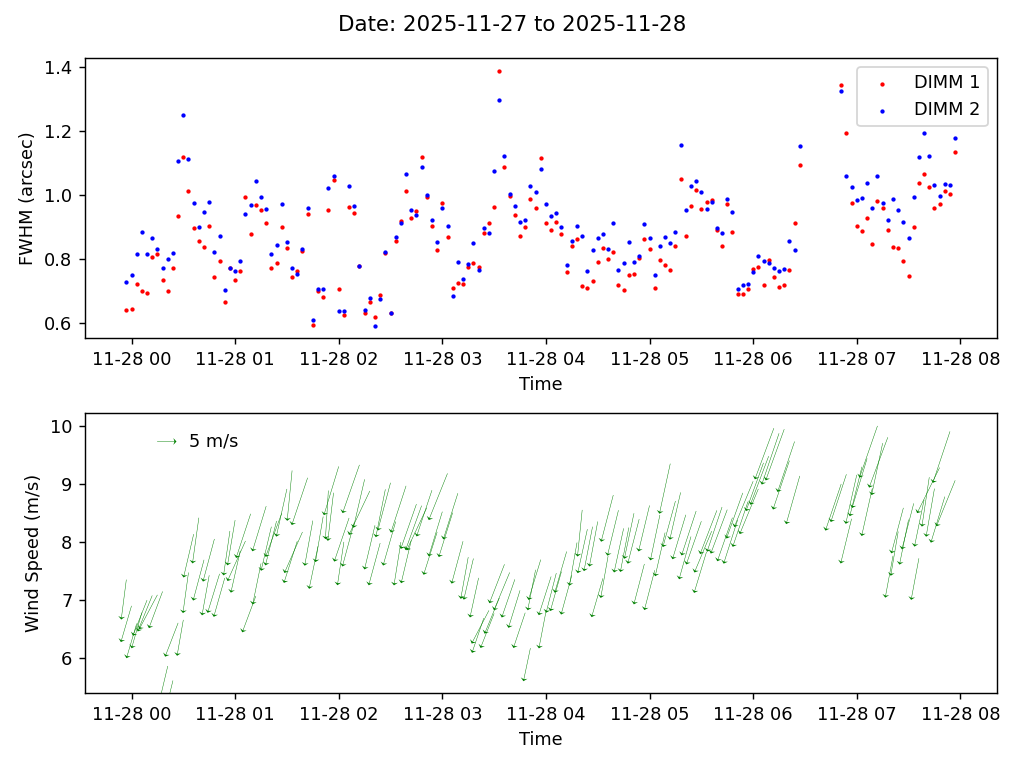
Fig. 4 Seeing measurements from both DIMMs (upper plot) and the wind speed and direction (lower plot) a function of time. The length of the arrows are proportional to the wind speed and their orientations indicate the wind direction (North is up).#
We see that both DIMMs measurements are compatible and even the short time scale seeing variations are seen by both devices.
In the following fifgure, we plot the difference between \(\text{DIMM}_1\) and \(\text{DIMM}_2\) seeing measurements as a function of the wind direction. The wind speed is color-coded. The wind is blowing from the North-North-East, with speed varying from 5.6 to 10 m/s.
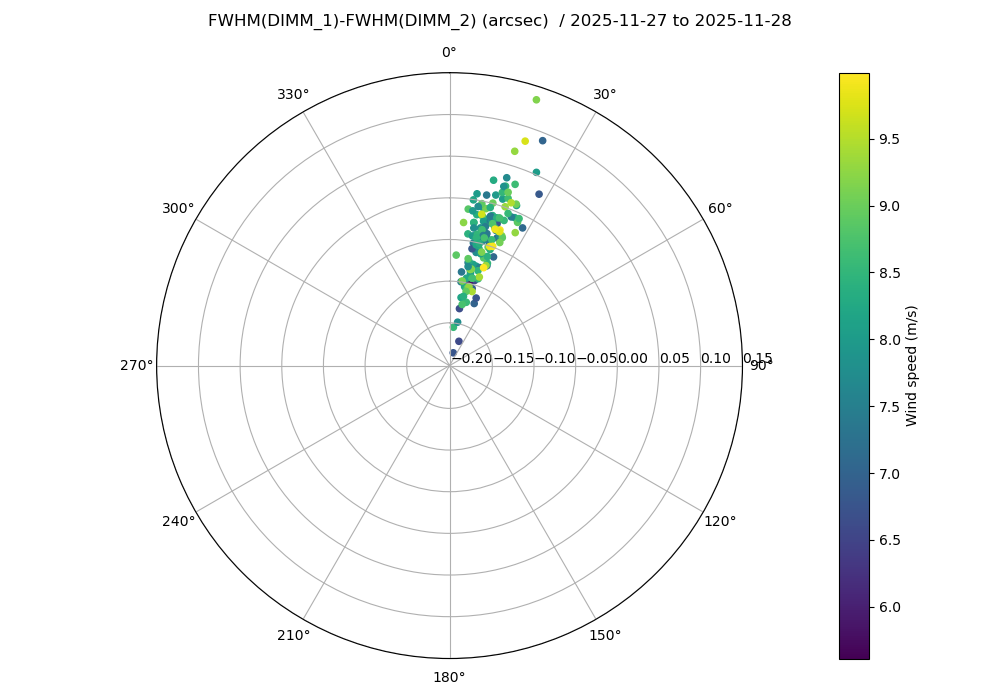
Fig. 5 Polar plot of \(\text{DIMM}_{1} - \text{DIMM}_2\) as a function of the wind direction. The wind speed is indicated by the color scale.#
In the next figure we plot the difference between both DIMMs seeing measurement as a function of wind speed (left). We also plot the histogram of the difference between both DIMMs (right). We conclude that for this range of wind speeds and directions, both DIMMs measurements agree and there is no dependency on the wind speed,
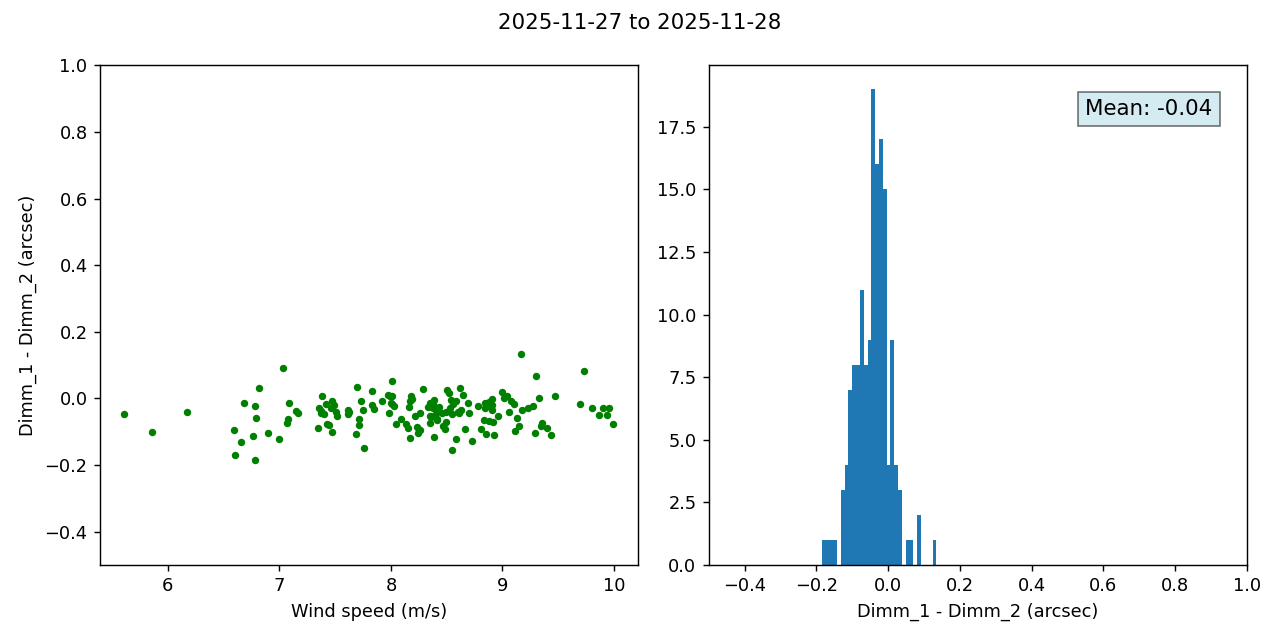
Fig. 6 Difference between \(\text{DIMM}_1\) and \(\text{DIMM}_2\) as a function of wind speed (left) and histogram of \(\text{DIMM}_{1} - \text{DIMM}_2\) (right).#
Wind speed lower than 4 m/s mainly from the North-North-East#
In the following figure we plot the seeing measurements from both DIMMs (upper plot) and the wind speed and direction (lower plot) a function of time.
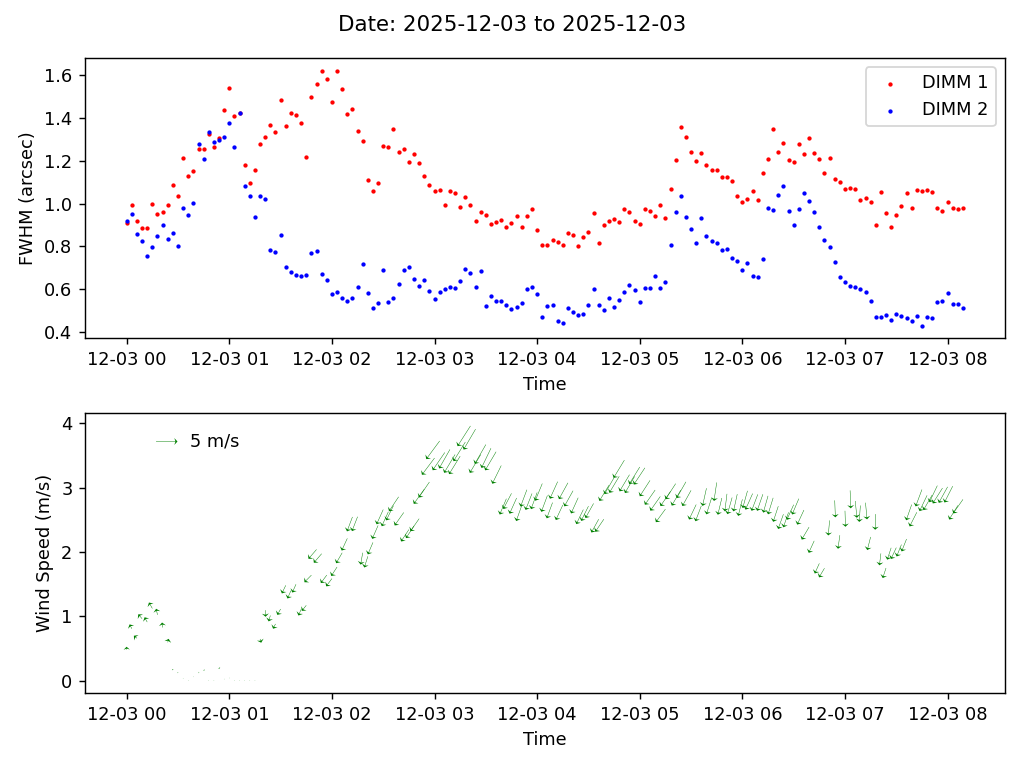
Fig. 7 Seeing measurements from both DIMMs (upper plot) and the wind speed and direction (lower plot) a function of time. The length of the arrows are proportional to the wind speed and their orientations indicate the wind direction (North is up).#
We see a large discrepancy between both DIMM measurements for wind speed larger than 1 m/s and blowing trom the North-North-East. Nevertheless we notice that before 1am (left part of the plot) both DIMMs seem to agree while the wind speed is very low and the wind direction is changing.
This behavior may be better seen on the following polar plots.
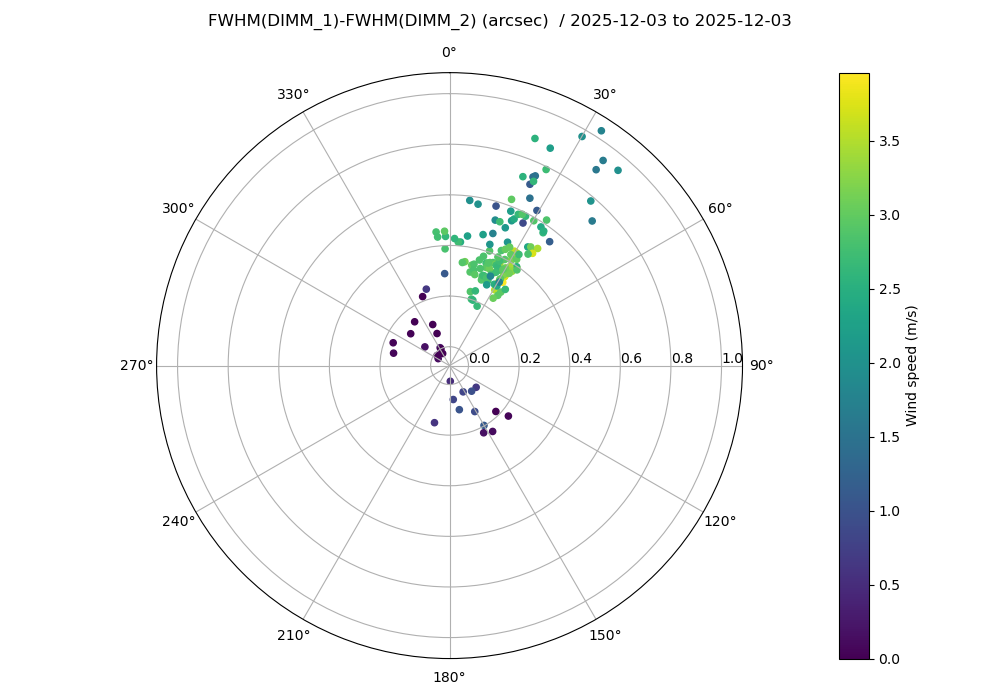
Fig. 8 Polar plot of \(\text{DIMM}_{1} - \text{DIMM}_2\) as a function of the wind direction. The wind speed is indicated by the color scale.#
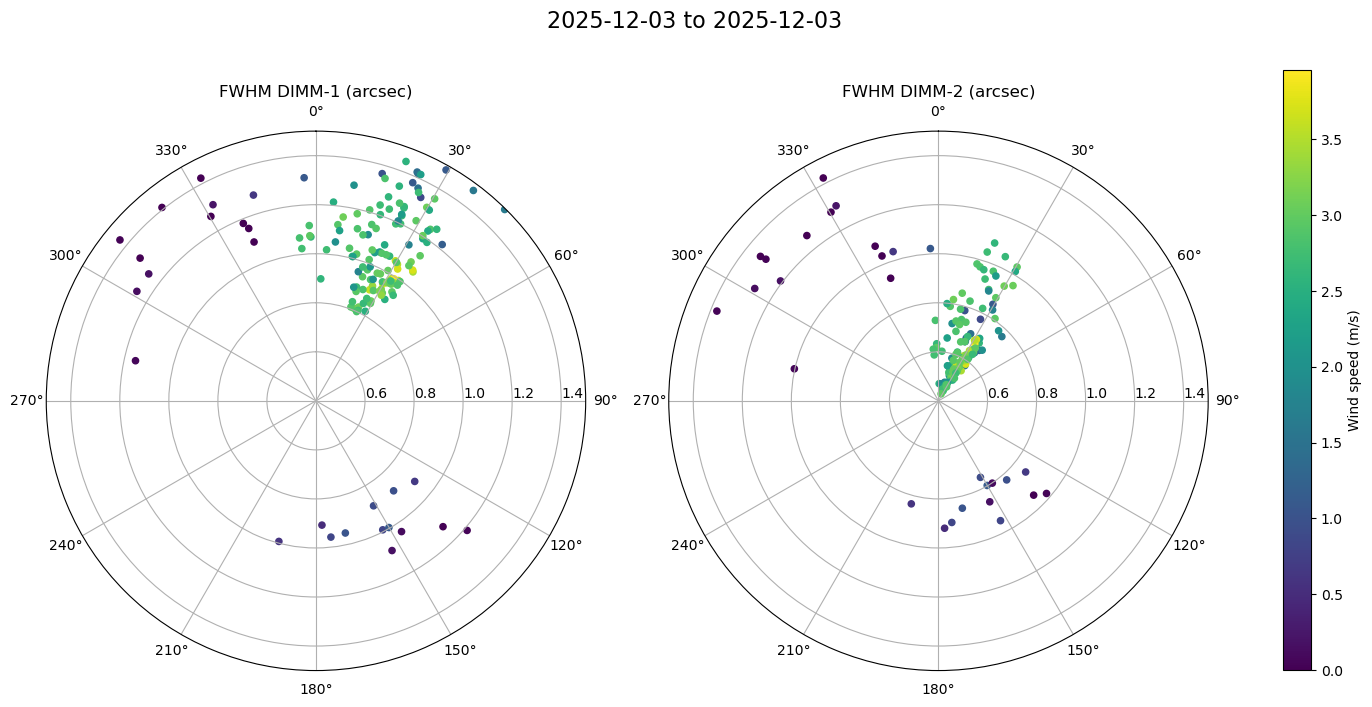
Fig. 9 Polar plot of \(\text{DIMM}_1\) and \(\text{DIMM}_2\) separately as a function of the wind direction. The wind speed is indicated by the color scale.#
In the next figure we plot the difference between both DIMMs seeing measurement as a function of wind speed (left). We also plot the histogram of the difference between both DIMMs (right).
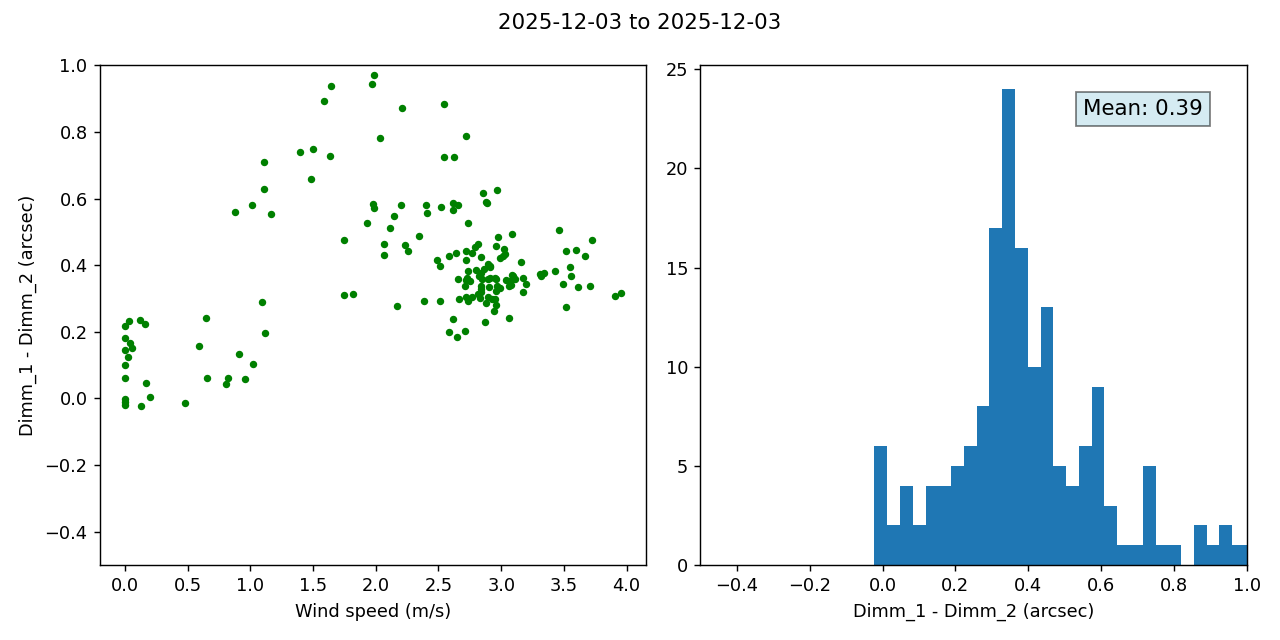
Fig. 10 Difference between DIMM-1 and DIMM-2 as a function of wind speed (left) and histogram of \(\text{DIMM}_{1} - \text{DIMM}_2\) (right).#
We see that the difference \((\text{DIMM}_{1} - \text{DIMM}_{2})\) is much more scattered than in the previous high-wind regime (wind speed > 4 m/s) with a possible anti-correlation between \((\text{DIMM}_{1} - \text{DIMM}_{2})\) and the wind speed for wind speed between 1.5 and 4 m/s. We also clearly see a change of behavior around 1 m/s.
Wind direction from the South#
Here we are going to investigate the case where thge wind is blowing from the South (opposite to the dominant direction). In the following figure we plot the seeing measurements from both DIMMs (upper plot) and the wind speed and direction (lower plot) a function of time.
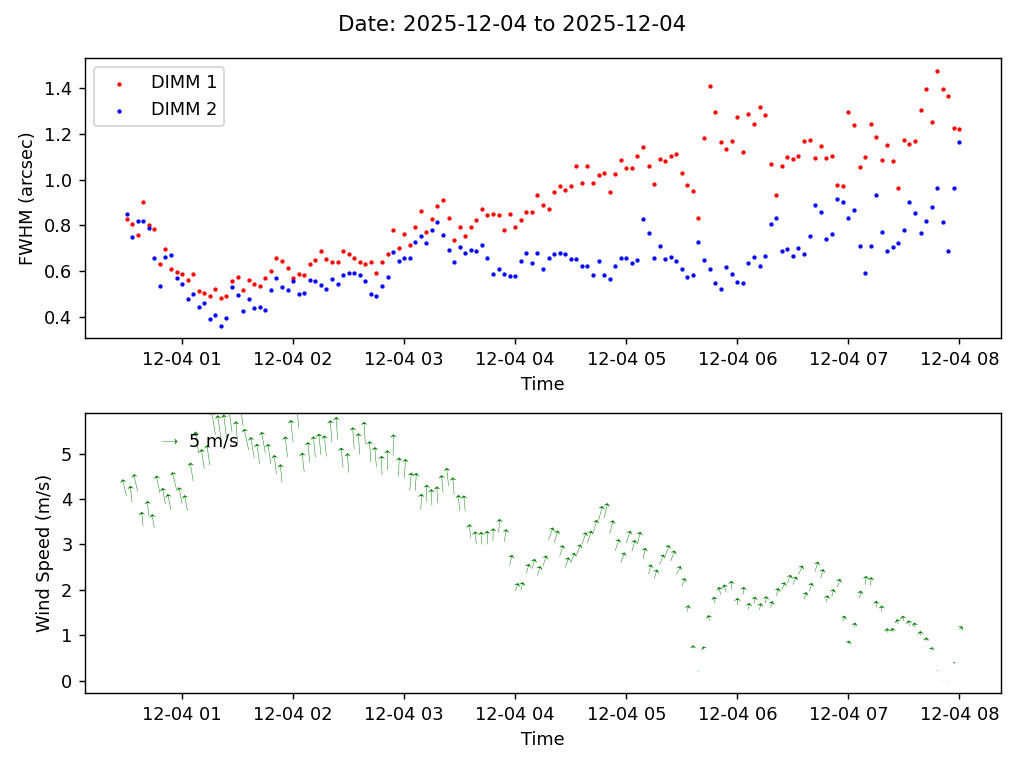
Fig. 11 Seeing measurements from both DIMMs (upper plot) and the wind speed and direction (lower plot) a function of time. The length of the arrows are proportional to the wind speed and their orientations indicate the wind direction (North is up).#
Despite of the wind blowing from the South, we observe the same kind of behavior with respect to wind speed. For wind speed >4 m/s both DIMM measurements tend to agree and we observe a transition around 4 m/s where the seeing estimations diverge sometimes by a large factor.
The following figures are the polar plots for \((\text{DIMM}_{1} - \text{DIMM}_{2})\) and \(\text{DIMM}_{1}\), \(\text{DIMM}_{2}\) separately.
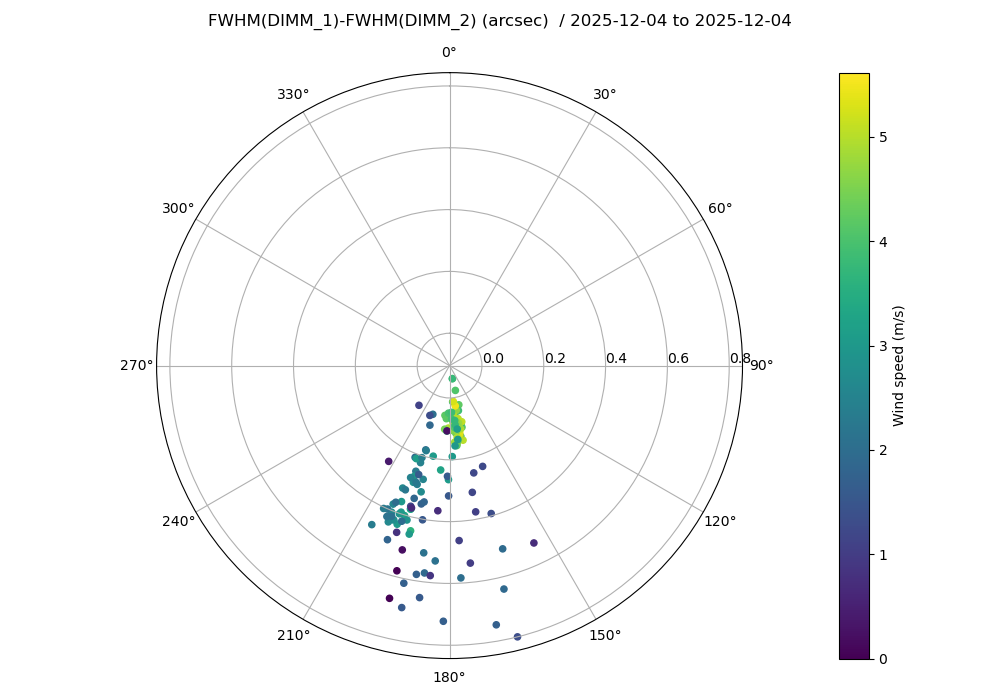
Fig. 12 Polar plot of \(\text{DIMM}_{1} - \text{DIMM}_2\) as a function of the wind direction. The wind speed is indicated by the color scale.#
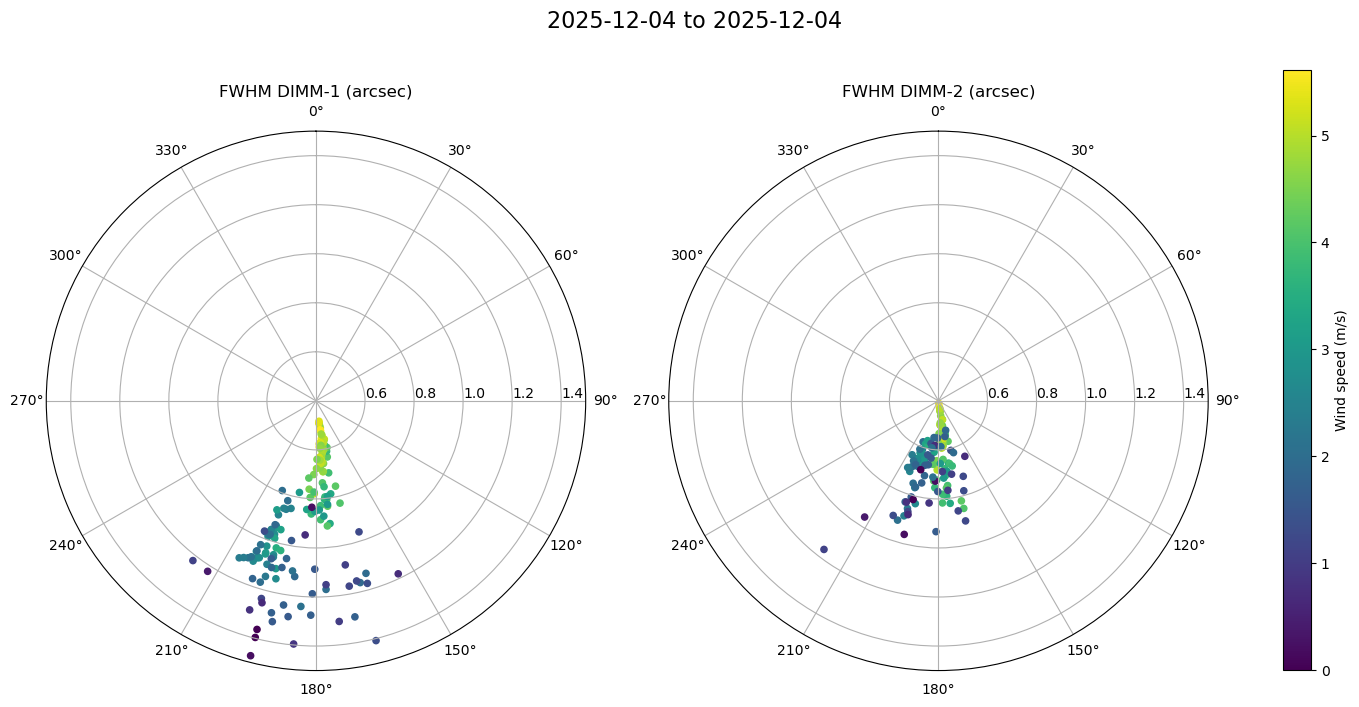
Fig. 13 Polar plot of \(\text{DIMM}_{1}\) and \(\text{DIMM}_{2}\) separately as a function of the wind direction. The wind speed is indicated by the color scale.#
And finally, the difference between both DIMMs seeing measurement as a function of wind speed (left) and the histogram of the difference between both DIMMs (right).
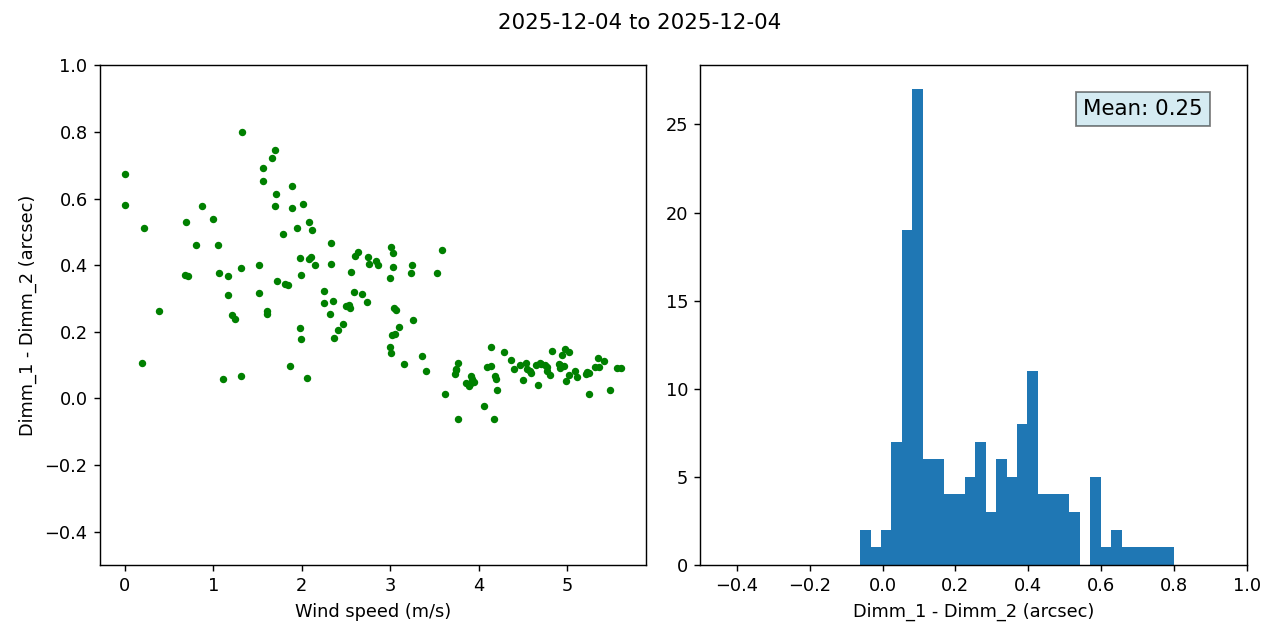
Fig. 14 Difference between DIMM-1 and DIMM-2 as a function of wind speed (left) and histogram of \(\text{DIMM}_{1} - \text{DIMM}_2\) (right).#
Here again we distinguish 2 regimes, the first one at low wind speed (<4 m/s)>) with a large difference between both DIMMs measurements and the second one at high wind speed with a much better agreement (with DIMM_1 slightly larger than DIMM_2 though) and independent of the wind speed.
Low wind speed and wind changing direction#
In the following we have selected a night where the wind speed is low (<2.7 m/s)>) and is changing direction. The wind is blowing from the South mat the beginniong of the night, then almost stops and turn to the North.
In the following figure we plot the seeing measurements from both DIMMs (upper plot) and the wind speed and direction (lower plot) a function of time.
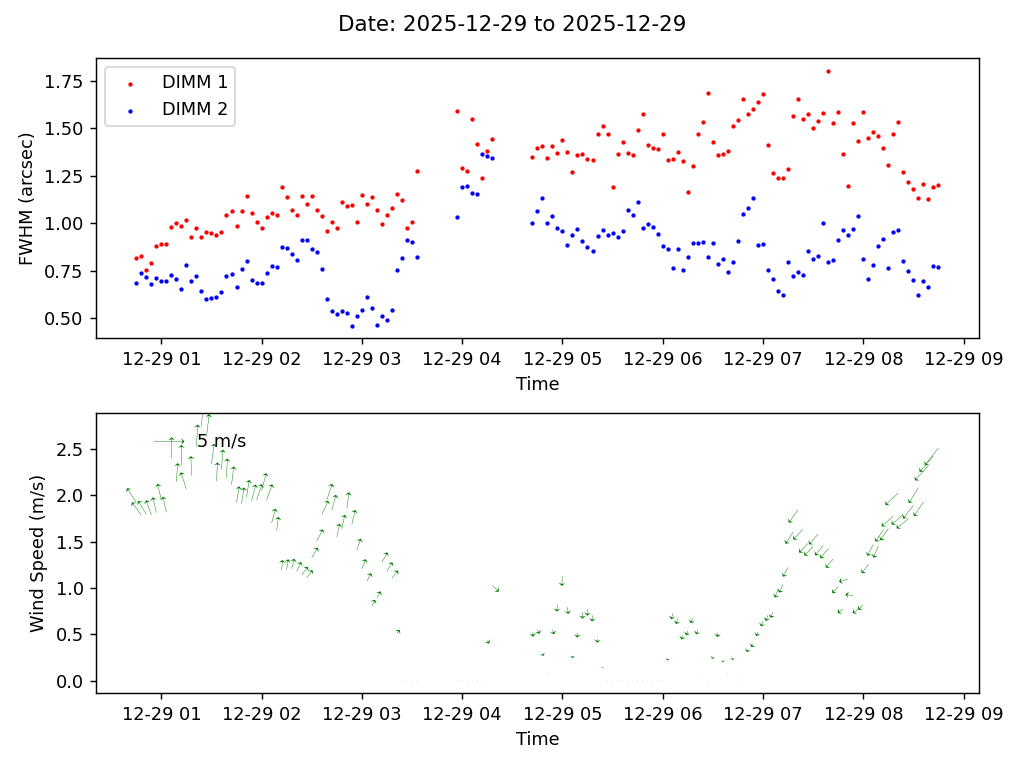
Fig. 15 Seeing measurements from both DIMMs (upper plot) and the wind speed and direction (lower plot) a function of time. The length of the arrows are proportional to the wind speed and their orientations indicate the wind direction (North is up).#
We see that there is a large discrepancy between \(\text{DIMM}_{1}\) and \(\text{DIMM}_{2}\) measurements independantely of the wind direction.
The following figures are the polar plots for \((\text{DIMM}_{1} - \text{DIMM}_{2})\) and \(\text{DIMM}_{1}\), \(\text{DIMM}_{2}\) separately.
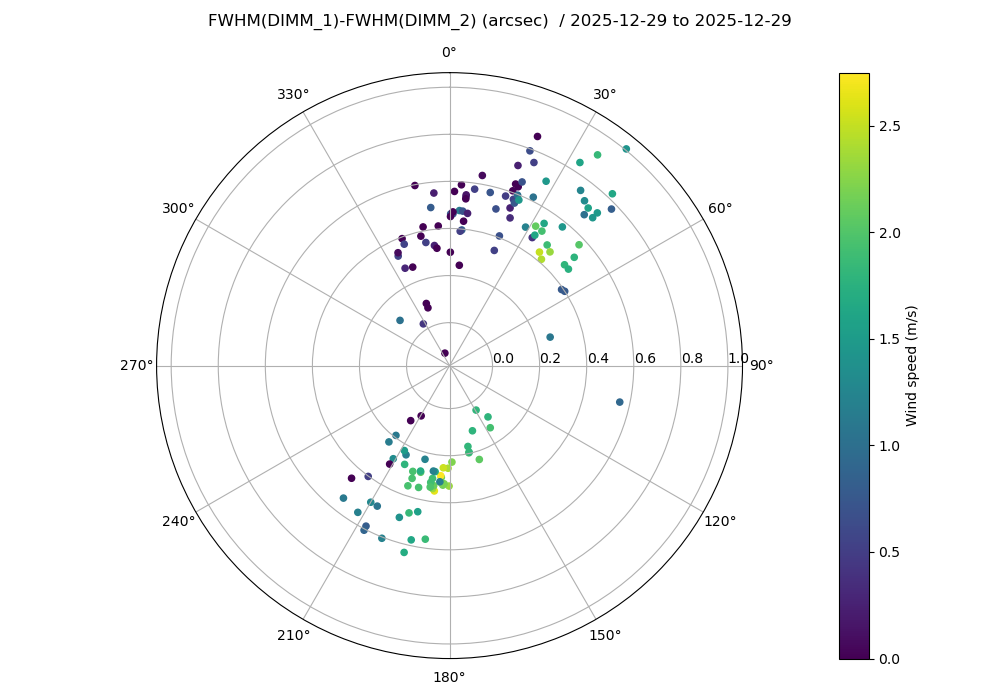
Fig. 16 Polar plot of \(\text{DIMM}_{1} - \text{DIMM}_2\) as a function of the wind direction. The wind speed is indicated by the color scale.#
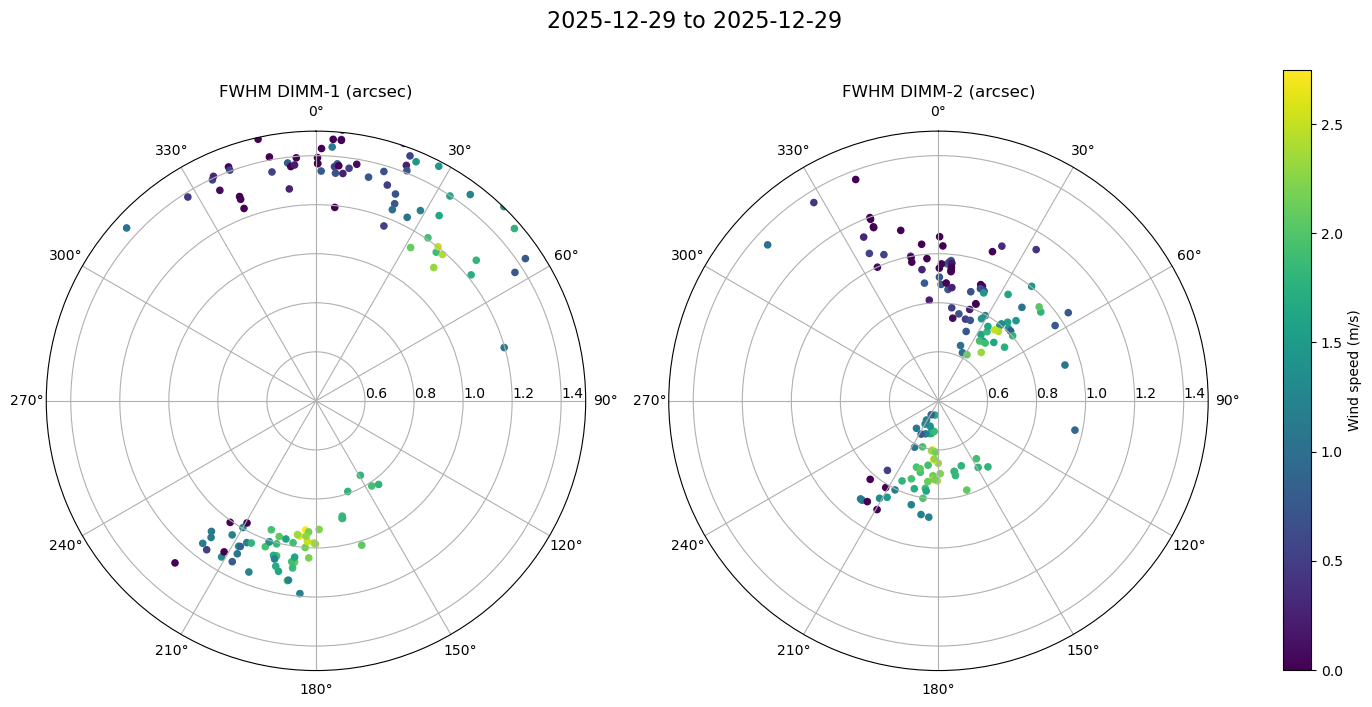
Fig. 17 Polar plot of \(\text{DIMM}_{1}\) and \(\text{DIMM}_{2}\) separately as a function of the wind direction. The wind speed is indicated by the color scale.#
And finally, the difference between both DIMMs seeing measurement as a function of wind speed (left) and the histogram of the difference between both DIMMs (right).
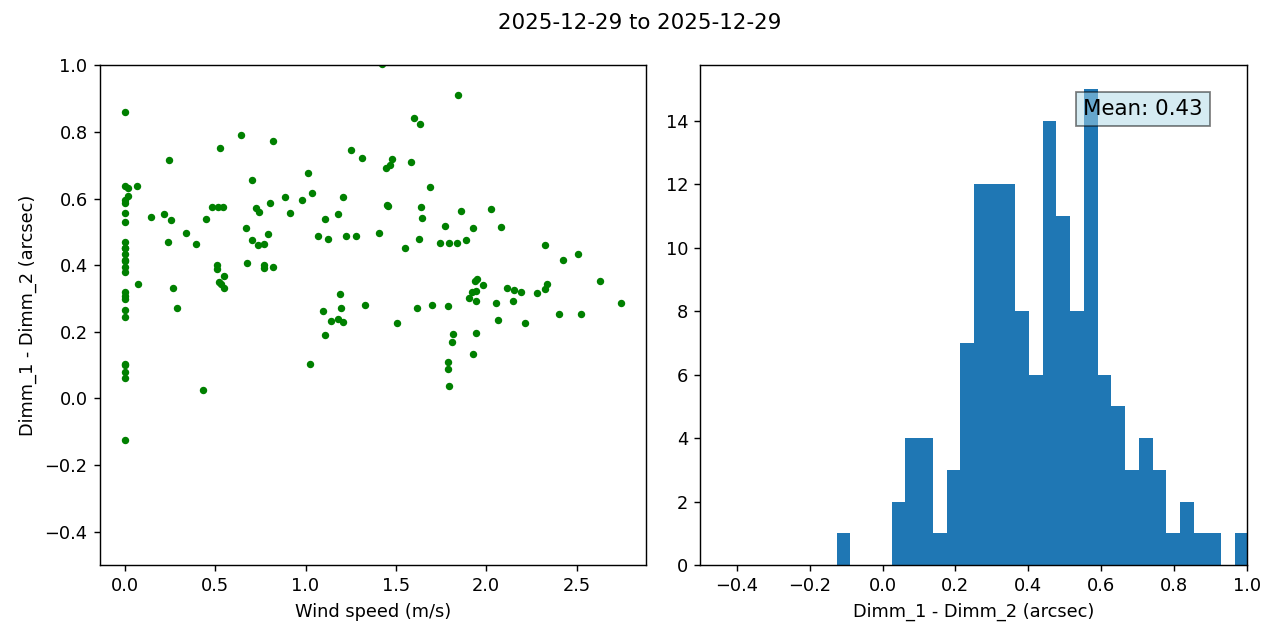
Fig. 18 Difference between DIMM-1 and DIMM-2 as a function of wind speed (left) and histogram of \(\text{DIMM}_{1} - \text{DIMM}_2\) (right).#
Counter example#
Between Novenber 2025 and January 2026, we have carefully monitored both DIMMs and we have observed the same pattern with both DIMMs giving compatible measurements for wind speed larger than 4 / 4.5 m/s and \(\text{DIMM}_1\) systematically giving a higher seeing value than \(\text{DIMM}_2\) for lower wind speed. During this whole period, we have found only one single counter example where we saw a discrepancy for wind speed > 5m/s and wind blowing from the South. This is illustrated on the following figure.
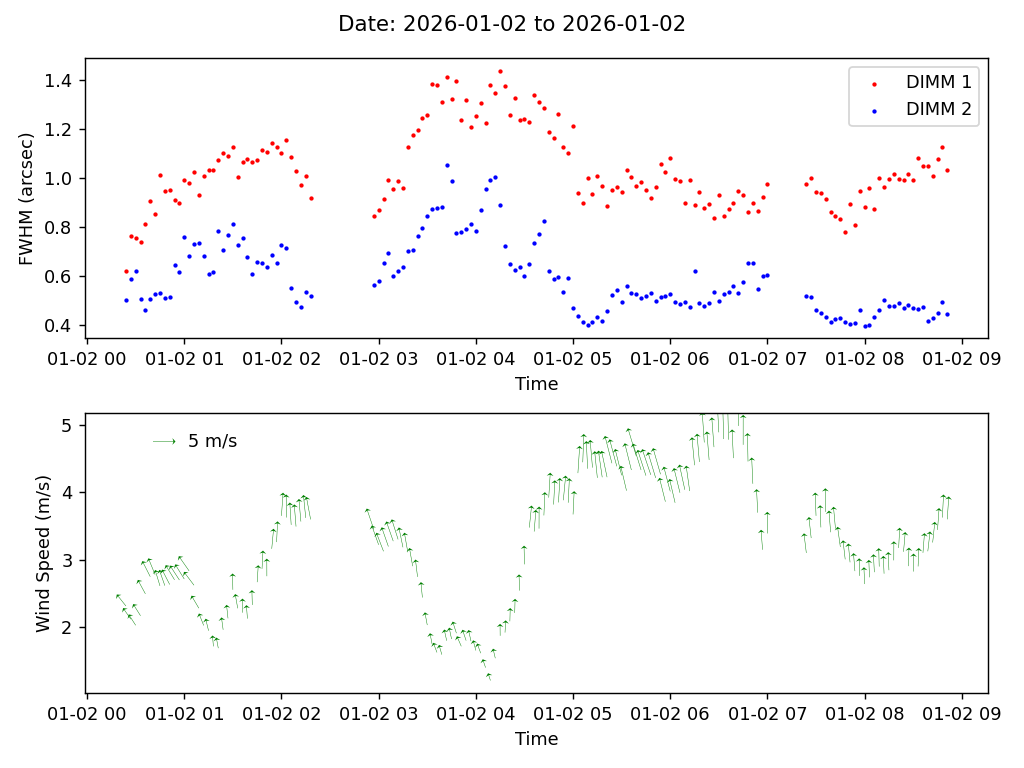
Fig. 19 Seeing measurements from both DIMMs (upper plot) and the wind speed and direction (lower plot) a function of time. The length of the arrows are proportional to the wind speed and their orientations indicate the wind direction (North is up).#
Conclusions#
Wind Speed Dependency: A clear divergence between \(\text{DIMM}_1\) and \(\text{DIMM}_2\) seeing measurements is established for wind speeds below 4.0–4.5 m/s. This effect appears to manifest independently of wind direction; however, it should be noted that due to the prevailing wind patterns on Cerro Pachón, testing has primarily been restricted to North and South vectors.
Consistency with LSSTCam: Based on the findings in sitcomtn-169, we conclude that the portable \(\text{DIMM}_2\) measurements are more consistent with the PSF FWHM measured on LSSTCam data.
Hypotheses for Divergence: The physical origin of this discrepancy remains under investigation, with two primary hypotheses currently being considered:
Internal Dome Turbulence: A localized turbulent regime within the dome housing the tower DIMM, potentially driven by thermal gradients.
Orographic Effects: Turbulence induced by the specific cliff topography and terrain configuration of the Cerro Pachón summit.
The second hypothesis (orographic effect) appears less plausible, as it would be difficult to account for an identical impact on measurements when the wind originates from opposite directions.